All File Menu Options
The file menu is purely used for Saving and Loading things. Note that saving networks should be done in the network table in the bottom right and not here.
Save
The save menu saves everything to the active directory (as referenced by the command window running the program) using generic names. This can be used for quick saving.
- ‘Save Current Session’
Saves all of the active core NetTracer3D properties (see Properties of a Network3D Object) into the current session folder, or prompts you to create one if you haven’t.
- ‘Save Nodes’
Saves the nodes channel into the current session folder as ‘labelled_nodes.tif’
- ‘Save Edges’
Saves the edges channel into the current session folder as ‘labelled_edges.tif’
- ‘Save Overlay 1’
Saves Overlay 1 into the current session folder as ‘overlay_1.tif’
- ‘Save Overlay 2’
Saves Overlay 2 into the current session folder as ‘overlay_2.tif’
- ‘Save Highlight Overlay’
Saves the Highlight Overlay into the current session folder as ‘Highlighted_Element.tif’
Save As
The save as menu will prompt the user to name files and select a directory while saving.
- ‘Save Current Session As’
Prompt the create a new folder/directory to dump all the properties (see Properties of a Network3D Object) of the current session. This folder can later be used to reload this session, provided you have not changed any of the filenames within.
- ‘Save Nodes As’
Prompts the user to save the nodes channel as a .tif.
- ‘Save Edges As’
Prompts the user to save the edges channel as a .tif.
- ‘Save Overlay 1 As’
Prompts the user to save the Overlay 1 as a .tif.
- ‘Save Overlay 2 As’
Prompts the user to save the Overlay 2 as a .tif.
- ‘Save Highlight Overlay As’
Saves the Highlight Overlay as a .tif.
Note that for saving any .tif, if you end the save name with ‘compressed.tif’, the system will save a compressed version of the tif for you which can be way smaller for labeled images specifically but still readable by most tif readers.
Load
The save as menu will prompt the user to find files to load. Note that when it comes to loading images, NetTracer3D does not like loading channels of different dimensions. If the user tries to do this, they will be prompted to have the image be auto-resized to the same dimensions as previous ones that exist in the Image Viewer Window. The user is advised to accept this, but can ignore it at their own risk of crashing the program.
- ‘Load Previous Session’
Prompts the user to find a folder containing the saved outputs from their previous session. These folders will typically be generated by the ‘Save(As) Network3D Object’ function. When the Network3D Object is assembling, the program will look for files that have the generic names that were assigned with the ‘Save(As) Network3D Object’ function (Or the generic Save (Not Save As) options in general). Files under different names will be ignored.
- ‘Load Nodes’
Prompts the user to find a .tif/.tiff/.nii/.jpg/.jpeg/.png image to load into the nodes channel. Only supports grayscale (Color images will be converted to grayscale).
- ‘Load Edges’
Prompts the user to find a .tif/.tiff/.nii/.jpg/.jpeg/.png image to load into the edges channel. Only supports grayscale (Color images will be converted to grayscale).
- ‘Load Overlay 1’
Prompts the user to find a .tif/.tiff/.nii/.jpg/.jpeg/.png image to load into the Overlay 1 channel. Supports color images.
- ‘Load Overlay 2’
Prompts the user to find a .tif/.tiff/.nii/.jpg/.jpeg/.png image to load into the Overlay 2 channel. Supports color images.
- ‘Load Full Sized Highlight Overlay’
Prompts the user to find a .tif/.tiff/.nii/.jpg/.jpeg/.png image to load into the Highlight Overlay.
Note that this exists because for images that are sufficiently large, the highlight overlay is rendered only on the visible plane rather than making a 3D image. However, the full highlight overlay is rendered for any method that needs it (such as showing 3D visualization). If a highlight overlay is present in reference to the nodes (for example) in such a case of a large image, and the user loads something else into the nodes channel, the highlight overlay will be altered to instead reference the new nodes. Loading the desired overlay directly with this function bypasses the mini plane-based highlight overlay, for example for 3D visualization.
- ‘Load Network’
Prompts the user to find a .csv/.xlsx file containing network data in the structure NetTracer3D expects (that is, the same structure it saves .csv/.xlsx networks as).
- ‘Load From Excel Helper’
Opens the excel helper, which is a seperate GUI to open less-structured .csv or .xlsx spreadsheets that the user may have obtained elsewhere, and more easily convert them into NetTracer3D properties. (See Using the Spreadsheet Loader)
As of now, this can be used to load in ‘Node Centroids’, ‘Node Identities’, or ‘Node Communities’.
- ‘Load Misc Properties -> Load Node IDs’
Prompts the user to find a .json/.csv/.xlsx file containing Node IDs in the structure NetTracer3D expects (that is, the same structure it saves node IDs as).
The user will be further prompted if they want to update/merge or replace the existing node IDs. The update option will add any new, unique IDs for each node to its identity list. This is especially useful if you encode identities for the same nodes in different sessions and want to combine them. The replace will just overwrite what’s present, which is the same behavior as when a new session is loaded.
- ‘Load Misc Properties -> Load Node Centroids’
Prompts the user to find a .csv/.xlsx file containing Node Centroids in the structure NetTracer3D expects (that is, the same structure it saves Node Centroids as).
- ‘Load Misc Properties -> Load Edge Centroids’
Prompts the user to find a .csv/.xlsx file containing Edge Centroids in the structure NetTracer3D expects (that is, the same structure it saves Edge Centroids as).
- ‘Load Misc Properties -> Load Node Communities
Prompts the user to find a .csv/.xlsx file containing network communities in the structure NetTracer3D expects (that is, the same structure it saves communities as).
Images -> Node Identities
- ‘Load Misc Properties -> Merge Nodes’
Prompts the user to find a .tif/.tiff file corresponding to an additional labeled nodes image they would like to merge with the current nodes channel (Alternatively, the user can select a directory containing a set of .tif/.tiff images if they would like to merge many nodes images at once).
The point of this function is to allow nodes from several types of images to be compared, for example, heterogenous structures or cell types.
Note that at this point in time, these labels cannot overlap as they are being combined into one image.
However, to address the above, the user is prompted to generate the centroids for each image prior to merging. Please select this if you want the image’s true centroid to enter NetTracer3D, regardless of what the merged output looks like. An optional downsample factor may also be entered, which finds centroids on a downsampled image before transposing the result, however note that this risks losing nodes that are especially small.
Generally one would segment the images and label them individually before trying to merge them.
Merging nodes auto-assigns the nodes IDs based on the name of the .tif/.tiff that is being merged, while the original nodes aquire the name ‘root_nodes’.
These IDs cannot be changed in NetTracer3D. To change them, please save the Node IDs as described above, then reassign the names with the excel helper, or edit the names directly in a spreadsheet-editing software like Microsoft Excel, then reload the Node IDs with ‘Load -> Load Misc Properties -> Load Node IDs’
- Assign Node Identities From Overlap With Other Images’
This is going to be the main way to assign node identities for multichannel data. You can either segment your cells or create hexagon nodes from the generate menu, place all desired channels in a folder, and run this.
Essentially, you will have a few options to iterate through the channels in your folder and assigning your cells as having that identity based on min/max thresholds of that cells’ fluorescent intensity.
Once you have your labeled nodes loaded into the nodes channel, running this will open this menu:
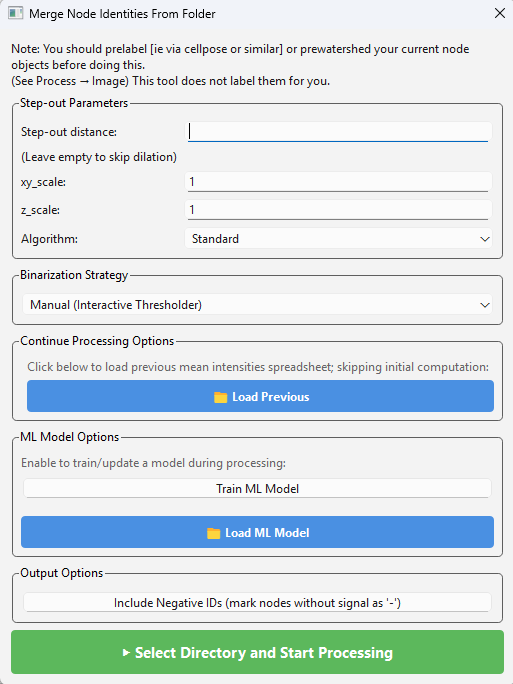
Parameter Explanations
- The first set of options is to optionally expand your nodes’ search regions:
Step-out distance - The node markers can search outwards for overlap (estimating a cell radius) based on a user defined distance (or this can be precomputed in ‘Process -> Image -> Dilate’).
xy_scale - The true scale of the xy plane of the image.
z_scale - The true scale of the z-step size of the image (note that for params 2 and 3, if entered correctly you will want to enter a true biological distance in param 1).
- The second box (Binarization Strategy) allows you to control how the system will choose to decide to assign your nodes as having an identity. It has these options:
Auto-Binarize - If you already had binarized your channels or the SNR is particularly good, you can try this one. For pre-binarized, you’d essentially segmente every channel for what you feel is ‘real’ and arrange those segmented channels in the target folder. If it sees any non-binary data, it will predict the foreground with Otus algorithm, which won’t necessarily give you ideal results.
Manual - This is the default setting and the main way to use this function. If you choose this, every channel will be loaded into the GUI one by one, allowing you to manipulate thresholds to choose which cells get assigned an identity. Please see the tutorial on proximity networks for more info.
Auto with ML Predictor - You will have to have trained a neural network model on some prior dataset. After that, you can load the ML model back to this window. If you choose this setting, the neural network will predict the threshold bounds based on its training data.
Using Previous Threshodls - If you’ve thresholded before for a set of channels, you can reapply these thresholds by loading the same spreadsheet back (That NetTracer3D generates at the end of the thresholding session).
The third box (Load Previous) allows you to load a table from a previous session containing the average intensity expression for every cell. Normally, this will have to be calculated for every channel of interest, and you will be prompt to save the resultant spreadsheet. If you are reapplying thresholds or want to add additional channels, you can load that same spreadsheet back here to skip pre-processing for channels that already have data. If you are adding additional channels to a previous session, I recommend loading the old spreadsheet like so. You will be prompted to save a new spreadsheet at the end with the old + new data in it.
- The fourth box concerns training the ML model. Currently this model is a neural network trained to associate the shape of the curve of the histogram with the thresholds you like. This may be tweaked in the future.
The top button allows you to enable training an ML model for this session. After training on all your channels, you will be prompted to save the model. If you load a previous model and choose this, you will train atop the old one.
The bottom button loads a previous model, which will be saved as a .pkl file. Please be aware to not load .pkl files you don’t trust (as in you don’t know who made them) as they can execute arbitrary code on your system. Once you’ve loaded a previous model, you can either have the ML model predict every threshold as mentioned above, or you can continue with the manual threshold, and you’ll have a new option for each to have the system make an initial guess.
The last box (Include Negative IDs) assigns nodes a ‘negative’ ID for each channel they don’t have, in addition to the one’s they do. This can bloat your data quite a bit and isn’t necessary usually, but the option is available if you want that level of detail.
When you’re ready, hit ‘Select Directory and Start Processing’. You will be prompted to navigate to the directory where you’ve stored your channels (as either 2D or 3D tiffs). Stored channels should be serial, not all in one tiff. If you already have node identities, any new ones from your thresholding session will be added onto the existing ones, allowing you to add more channels to previous sessions. Any channels that exist in the identities currently that are also in the current session will be overridden by the new thresholds, which can be used to correct past mistakes.
Next Steps
This concludes the explanations of the file menu. Next, proceed to All Analyze Menu Options for information on the analyze menu functions.